
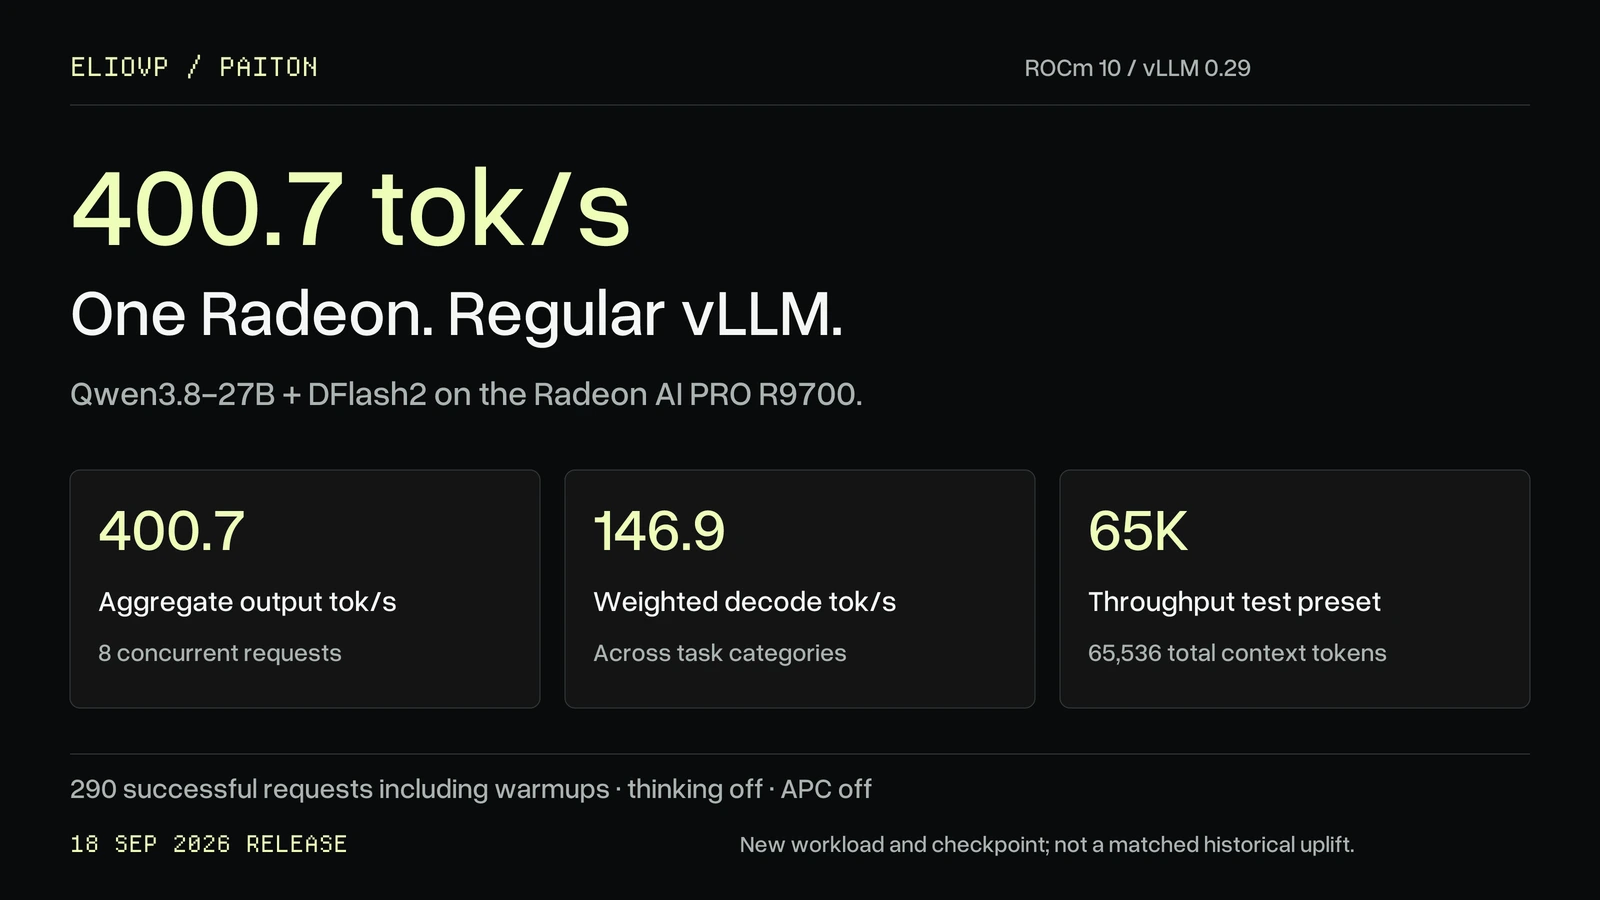
400.7 aggregate output tokens per second on one Radeon AI PRO R9700. The 18 September release moves to ROCm 10 and vLLM 0.29.0, with a 65K throughput preset and configurable long-conversation profiles. Weighted decode is 146.9 tok/s; the JSON category reaches 215.9 tok/s.1
Updated 19 September 2026. Start with the current benchmark, 200K/220K conversations and prefix caching, or current launch instructions. The original 57% comparison and the 17 September experiments remain below as historical evidence.
A new release, not a new matched percentage claim. This run uses unsloth/Qwen3.8-27B-NVFP4 through the MXFP4 runtime path, rather than the earlier AMD checkpoint. The runtime, sampling and benchmark workload also changed. We do not divide 400.7 by an older result to claim a controlled speedup over Radiance or the previous Paiton release.
Current release: 400.7 tok/s on one R9700
These results come from one complete BetterBench 0.6.0 validation run: 290 successful requests including warmups, on one 32 GB R9700 at a 300 W power limit. The 65,536-token preset was tested with thinking disabled and APC off. Sampling was temperature 0.7, top-p 0.95, top-k 20 and seed 42. A power limit is not a measured electricity-use result.1
65K release preset; 48 requests at each concurrency level. Aggregate output divided by total wall time, not per-user decode speed. Published tables · Chart data.
| Concurrent requests | Aggregate output tok/s |
|---|---|
| 1 | 115.0 |
| 2 | 203.2 |
| 4 | 296.5 |
| 8 | 400.7 |
Decode across real task categories
The weighted decode score is 146.9 tok/s. The category medians below use five scored runs after one warmup per category. The JSON result is a category result, not the overall speed a user should expect.
| Category | Median decode tok/s |
|---|---|
| Chat | 123.7 |
| Code | 169.2 |
| File editing | 185.0 |
| JSON | 215.9 |
| Math | 182.7 |
| Prose | 74.9 |
| Reasoning | 112.5 |
| Summarization | 115.0 |
Prefill as the prompt grows
BetterBench divides actual prompt tokens by time to first token. Each depth has eight scored runs after two warmups. Requested depth labels are not the actual tokenized prompt lengths.
| Requested depth | Median actual prompt tokens | Median prefill tok/s |
|---|---|---|
| 2,000 | 1,516.5 | 3,503.6 |
| 8,000 | 5,894.5 | 3,530.4 |
| 16,000 | 11,802.0 | 3,536.9 |
| 32,000 | 23,549.5 | 3,393.0 |
| 64,000 | 47,016.5 | 3,113.0 |
These are measurements of the 65K configuration, not 200K throughput. “65K” means 65,536 total context tokens, the same count previously described as “64K”; the name alone does not represent a larger context window.
Long conversations: prefix caching you can try
The new public launchers make context a startup setting, not a compiled image limit. The context budget includes the prompt, chat/tool formatting and generated output. VRAM and the checkpoint's supported range still constrain deployment; eight scheduled requests do not mean eight full 65K conversations fit at once.
| Current startup choice | Total context | Maximum scheduled requests | APC |
|---|---|---|---|
| 65K release preset | 65,536 | 8 | Off |
| 200K release preset | 200,000 | 1 | Off |
| Chat profile | 200,000; tested override to 220,000 | 1 | On, experimental configuration |
| Desktop profile | 32,768 | 1 | Off |
The chat profile is now publicly runnable. It enables prefix caching for an unchanged conversation history, uses an 8 GiB KV pool, 1,024-token prefill chunks and thinking disabled. Use a dedicated R9700: spare VRAM is tight. This is a different configuration from the throughput benchmark, not APC enabled by default in the release presets.1
In one 220K-context retrieval probe, a 215,005-token prompt completed in 130.00 seconds cold and 1.77 seconds on an identical repeat, reusing 213,840 cached tokens. Both answers contained nine tokens at temperature zero. These are complete response times from a functional probe, not TTFT, a general latency guarantee or faster decode. Changed-prefix retrieval, two longer answers, a subsequent XML tool call and a fresh short request also passed. This is not broad long-conversation quality validation.
The separate 200K image check passed a 198,989-token prompt followed by generation and ordinary/streaming XML tool calls. The largest configured serving limit tested is 220,000, not the checkpoint's 262,144-token architectural ceiling.
Cache hits require an unchanged prefix still resident in memory. They avoid repeated prompt work, not generation of each new token. Disk caches used at startup are separate. The chat profile reports usage.prompt_tokens_details.cached_tokens; streaming clients also need "stream_options":{"include_usage":true}.
For a GPU shared with desktop applications, --profile desktop starts smaller, with a 2 GiB cache and one scheduled request. It is not a guarantee against running out of memory. Lowering context alone does not shrink a fixed KV allocation. These launchers are text-only; the separate vision smoke test is not a released 200K/220K multimodal profile.
Run the ROCm 10 release
Use Linux x86-64, Python 3, Docker, the Hugging Face CLI and one 32 GB Radeon AI PRO R9700 with working AMD GPU access. Get the public repository and run the commands from its root. For reproducibility, this article follows commit 8f56157c05eb6a53f6cdab00a115e47b42fed2d1. The launchers pin the public images by immutable digest. Do not reuse the old AMD checkpoint or historical automatic downloader for this release.
Select the GPU through the launcher's documented ROCm visibility environment variables. They are forwarded unchanged; inspect existing masks rather than combining indices blindly. See the GPU and memory controls. Run only one profile on the card at a time.
Start the 200K chat profile
The commands download the exact target and draft snapshots and start the server in the foreground. The first image pull is approximately 9.6 GB, excluding weights. Startup loads/converts weights and compiles runtime components, so wait for readiness before measuring performance. Subsequent starts reuse the persistent cache; no private compiler checkout is needed.
Version tagghcr.io/eliovp/paiton-vllm-plugin:qwen38-rocm10-vllm029-200k-20260918-r2sha256:32dab97330ea84b86967537d25f91878c30f21ff844f71369508c5a049b89178
export PAITON_TARGET_DIR="$PWD/model-cache/qwen38-nvfp4"
export PAITON_DRAFT_DIR="$PWD/model-cache/qwen38-dflash2"
export PAITON_CACHE_DIR="$PWD/runtime-cache/qwen38-rocm10-200k"
mkdir -p "$PAITON_TARGET_DIR" "$PAITON_DRAFT_DIR" "$PAITON_CACHE_DIR"

hf download unsloth/Qwen3.8-27B-NVFP4 \
  --revision f0b7c9e722f5565102fff8481c99e4d86ae099c7 \
  --local-dir "$PAITON_TARGET_DIR"
hf download tcclaviger/Qwen3.8-27B-DFlash2-FP8 \
  --revision ee0cb26a8279b7910cc28d82a8a3e15e4728d56f \
  --local-dir "$PAITON_DRAFT_DIR"

bash models/Qwen3.8-MXFP4-DFlash2/run-rocm10-200k.sh --profile chat --context 200000
The API uses http://127.0.0.1:18982/v1 and model name Qwen3.8, not the historical port and model name below:
curl --fail http://127.0.0.1:18982/health
curl --fail http://127.0.0.1:18982/v1/chat/completions \
  -H 'Content-Type: application/json' \
  -d '{"model":"Qwen3.8","messages":[{"role":"user","content":"Write a Python function that removes duplicate items while preserving order."}],"temperature":0.7,"top_p":0.95,"max_tokens":256,"stream":true,"chat_template_kwargs":{"enable_thinking":false}}'
Select the 65K benchmark preset
First stop the other server with docker stop paiton-qwen38-200k. Keep the same target and draft directories, then use:
Version tagghcr.io/eliovp/paiton-vllm-plugin:qwen38-rocm10-vllm029-65k-20260918-r2sha256:a896b5deca21e95771cd0057d27f3cb0f6ede95cb1146a7a78c883b9ae7d8444
export PAITON_CACHE_DIR="$PWD/runtime-cache/qwen38-rocm10-65k"
mkdir -p "$PAITON_CACHE_DIR"
bash models/Qwen3.8-MXFP4-DFlash2/run-rocm10-65k.sh
Set thinking explicitly in client requests to match the benchmark. The release preset's model template enables thinking if omitted; the chat profile and reported benchmarks disable it. Use --thinking off for a server default or "chat_template_kwargs":{"enable_thinking":false} per request.
For 220K conversations, stop the running server and use bash models/Qwen3.8-MXFP4-DFlash2/run-rocm10-200k.sh --profile chat --context 220000. Use the complete chat profile rather than assuming an isolated APC flag preserves memory requirements. The public guide documents the tested settings and limitations.
Original 16 September comparison
Historical scope: everything in the original comparison below uses the earlier AMD checkpoint, vLLM 0.28 and matched 8K configuration. Its 57% gain remains valid for those tests; it is not a percentage claim for the ROCm 10 release.
One Radeon AI PRO R9700. The same Qwen3.8-27B MXFP4 checkpoint. The same 5 GiB cache allocation. Paiton delivers 57% more aggregate throughput than our matched Radiance + DFlash2 baseline at eight concurrent requests and reduces median time to first token from 6.59 seconds to 195 milliseconds.
Throughput and latency headlines use the original matched 188-request comparison at eight concurrent requests and an 8,192-token context limit. Both accelerated engines use the same target and DFlash2 snapshots. GPU artwork is illustrative.
This is a substantial step forward for serving a 27B model on one workstation GPU. Not just faster generation when one person is waiting. More requests progressing together, almost three times the estimated cache-token capacity, and dramatically less waiting under load.
Paiton reaches 314.5 aggregate output tokens per second, against 200.3 tok/s for the matched accelerated baseline. Weighted serial decode improves by 22%, and prefill is faster at every tested prompt depth. The execution runs through a plugin on the official vLLM 0.28 ROCm runtime. The installed vLLM library stays unchanged.2
The important combination is performance and deployment: a much stronger local serving result without moving to a separate inference-engine distribution.
See it in action
Historical recording from the original release, not a demonstration of the new ROCm 10 benchmark or 220K chat profile.
Watch Qwen3.8 generate responses on one Radeon AI PRO R9700, with Paiton + DFlash2 running through regular vLLM. The recording shows streamed output alongside live generation figures and GPU activity.
70-second screen recording with one active request at a time. The live figures describe the requests shown, not the eight-request aggregate benchmark below.
Open the recording (MP4, 10.2 MB). Use the player's fullscreen control for a closer look.
A strong baseline. A bigger result.
The investigation began with the impressive work around vLLM-Radiance. Seeing what the team achieved on AMD hardware gave us ideas and encouraged us to push our own R9700 implementation further. Its public documentation describes support for the same AMD Quark MXFP4 model and DFlash2 acceleration; its published performance results use two R9700s.3
Radiance inspired the investigation. Paiton's native HIP integration includes techniques adapted from Radiance and libr4d, credited in the public third-party notices.
We wanted to answer a different question: how much could we deliver from this model on one card, while keeping the regular vLLM deployment path?
We ran Radiance + DFlash2 and Paiton on vLLM + DFlash2 ourselves on one R9700, using the same checkpoint, target and draft snapshots, FP8 KV cache, 5 GiB cache allocation and 8,192-token context ceiling. Both accelerated profiles used seven speculative tokens, greedy sampling and disabled prefix caching.2
Our percentage gains compare those matched single-GPU runs, not a one-card result against somebody else's two-card screenshot.
57% more throughput, with a growing lead under load
The original 57% result comes from the full 188-request BetterBench preset, not the shorter, 128-output-token-cap comparison. We retained the preset's original longer output budgets, ten measured passes per task category, 24 requests at each tested concurrency level and repeated prefill measurements. Both engines completed the full request set.24
Full 188-request workload, runs 495 / 494. Aggregate throughput includes prefill and queueing. Higher is better.
| Concurrent requests | Radiance + DFlash2 | Paiton on vLLM + DFlash2 | Paiton uplift |
|---|---|---|---|
| 1 | 76.9 tok/s | 89.6 tok/s | 16.5% |
| 2 | 142.7 tok/s | 165.7 tok/s | 16.1% |
| 4 | 187.1 tok/s | 254.8 tok/s | 36.2% |
| 8 | 200.3 tok/s | 314.5 tok/s | 57.0% |
Paiton leads at every tested concurrency level. The full task-category results also show a lead across code, reasoning, prose, JSON, file editing, summarization, math and chat. The improvement survives the longer workload instead of depending on a single favorable prompt.2
These are aggregate serving rates across the active workload. 314.5 tok/s does not mean each of eight users receives 314.5 tok/s.
From a 6.59-second wait to a 195-millisecond first token
The throughput gain is large. The change in responsiveness under load is larger.
At four concurrent requests, median time to first token falls from 1,627 ms to 180 ms. At eight, it falls from 6,586 ms to 195 ms: 97% lower. These timings include queueing, so they describe the wait a client experiences before a response begins.2
Full 188-request workload. Lower is better. Radiance retains a 10–11 ms TTFT advantage at one and two concurrent requests; Paiton still leads throughput at both levels.
For a shared coding assistant or local agent endpoint, throughput alone is not enough. An endpoint that produces more tokens but leaves requests waiting to start can still feel slow. Here, the higher concurrency result comes with a substantially shorter wait for that first token.
The same 5 GiB holds almost three times the token capacity
With exactly 5 GiB reserved on each engine, the runtimes report 25,746 cache-token slots for Radiance and 74,430 for Paiton. That is 2.89× estimated token capacity inside the same allocation.2
Runtime-reported shared-cache capacity estimates, not physical VRAM capacity. The per-request context ceiling was 8,192 tokens in this original benchmark configuration.
The run logs capture up to three active requests for Radiance versus eight for Paiton in this matched configuration. Those are observations from these runs, not universal concurrency limits for either engine.2
The extra capacity helps explain the stronger concurrent experience: more requests can make progress inside the same budget. The capacity figures and active-request observations align with the throughput and latency result, although they do not isolate cache handling as the sole cause of the improvement.
More usable serving capacity, not more VRAM or a larger advertised context window.
Faster decode. Faster prefill. Across the workload.
The gains are not confined to admitting more requests. In the full workload, weighted serial decode rises from 86.0 to 104.9 output tok/s: 22% higher. This measures generation after the first token and is separate from the aggregate complete-workload throughput above.2
Weighted serial decode, full workload. Same target and draft snapshots on the same R9700.
Prefill improves at every tested prompt depth as well. At approximately 1,556 / 3,024 / 5,226 input tokens, Radiance measures 2,828 / 3,003 / 2,926 input tok/s. Paiton reaches 3,182 / 3,521 / 3,367 input tok/s.2
Full-workload prefill results: 12.5%, 17.2% and 15.1% higher, calculated from the displayed summary values. Actual prompt tokens divided by HTTP time to first token, not isolated kernel throughput.
Together, these results show improvement at several points a user notices: getting the prompt processed, starting the answer under load and generating the rest of it.
Against stock vLLM, the whole-engine gap is striking
We also ran a separate 54-request matrix with generation capped at 128 tokens, comparing stock vLLM O2, Radiance + DFlash2 and Paiton on vLLM + DFlash2. The stock profile used the best O2 settings we tested.2
| Concurrent requests | Stock vLLM O2 | Radiance + DFlash2 | Paiton on vLLM + DFlash2 |
|---|---|---|---|
| 1 | 4.5 tok/s | 78.0 tok/s | 90.0 tok/s |
| 2 | 8.8 tok/s | 151.2 tok/s | 160.5 tok/s |
| 4 | 17.4 tok/s | 189.2 tok/s | 231.5 tok/s |
| 8 | 33.7 tok/s | 175.6 tok/s | 328.5 tok/s |
Separate 54-request matrix, runs 403 / 493 / 492. Values from the published benchmark summary. This table is not the source of the 57% headline.2
At eight concurrent requests, aggregate throughput rises from 33.7 tok/s on stock to 328.5 tok/s with Paiton, nearly tenfold. Weighted serial decode in this shorter comparison rises from 4.5 to 113.5 tok/s.2
The scope matters: stock uses checkpoint-native W4A4 emulation, while the accelerated configurations use W4A8 execution plus DFlash2. These are complete engine configurations on the same weights, not identical activation arithmetic or a claim that replacing one kernel delivers the entire gain. Nor do these figures describe every stock-vLLM model or quantization.
Prefill in the separate capped matrix, with actual tokenized prompt lengths. Keep these values separate from the full-workload prefill series above.
That is why the main headline uses the harder comparison: Paiton against an already accelerated Radiance + DFlash2 baseline, confirmed on the longer workload.
Regular vLLM. The installed library stays unchanged.
The deployment result is deliberate. Paiton integrates through vLLM's extension mechanisms and supplies native HIP runtime artifacts for the optimized execution. vLLM's plugin system is designed to support extensions without modifying its codebase.25
Paiton's native HIP kernels and integrated DFlash2 support provide the optimized execution on the official vLLM ROCm runtime. The release supplies the runtime artifacts needed for the tested deployment, including the DFlash2 integration, so users can deploy the supported profile without a separate DFlash package. Our Paiton compiler remains proprietary.26
For the original v1.0.0 release, we checked the ordinary vllm.entrypoints.openai.api_server entry point independently of the benchmark harness. It passed streaming chat, eight concurrent requests, a request at the configured 8K context boundary and a fresh request afterward. All 2,893 installed vLLM files matched the official base image. Validation applies to the pinned tested runtime and supported profile, not every vLLM feature or future version.2
Standard vLLM still carries its normal framework dependencies; Paiton's native libraries load independently of those frameworks. This is not a claim that the entire serving stack has become framework-free.
Completion and API checks are useful reliability checks. They are not an independent model-accuracy evaluation or a guarantee of identical generated text across execution profiles.
More output from the same active hour
The full-workload concurrency-eight rates translate into a useful capacity illustration. Sustaining 200.3 tok/s would produce about 721,000 output tokens per active hour. Sustaining 314.5 tok/s would produce about 1.13 million, roughly 411,000 additional output tokens from the same hour.
Equivalently, one million output tokens would take 1.387 active hours at the baseline rate or 0.883 hours at Paiton's rate: 36.3% less active time.
Arithmetic illustration using the full-workload concurrency-eight rates. Assumes those rates are sustained; this is not an hour-long measurement, energy measurement or financial-cost claim.
The hardware does not change. How much useful work it can deliver does.
Original benchmark configuration
| Component | Matched profile |
|---|---|
| GPU | One Radeon AI PRO R9700, gfx1201 |
| Target checkpoint | amd/Qwen3.8-27B-Quark-AWQ-MXFP4 |
| Accelerated profiles | Radiance + DFlash2; Paiton on official vLLM + DFlash2 |
| Paiton serving base | Official vLLM 0.28 ROCm runtime |
| Cache | FP8 KV; exactly 5 GiB reserved per engine |
| Context ceiling | 8,192 tokens per request |
| Concurrent requests tested | 1, 2, 4 and 8 |
| Speculation | Same target and draft snapshots; seven speculative tokens |
| Sampling | Greedy |
| Prefix caching | Disabled |
| Headline workload | Full 188-request preset with original output budgets |
| Supporting stock comparison | Separate 54-request matrix, output cap 128 |
These are results for the tested model, runtime and workload. They do not establish a guarantee for other GPUs, larger contexts, different drafters or untested concurrency levels.2
Longer conversations: two released profiles
17 September archive: the v1.1.0 profiles below are not the current ROCm 10 images. Use the current launch section for the latest release.
The original result answers a serving-performance question at 8K. A practical coding endpoint also needs space for documents, conversation history and tool results. The 17 September v1.1.0 images extend the available serving profiles without changing the pinned model weights or existing native libraries.7
| Profile | Total context | FP8 cache budget | Active-sequence limit |
|---|---|---|---|
| 64K v1.1.0 | 65,536 tokens | 5 GiB | Up to 8, subject to available cache |
| 200K v1.1.0 | 200,000 tokens | 8 GiB | 1 |
Context is the whole request budget: the tokenized prompt, chat and tool formatting, and generated output. Reserve space for the answer. Eight scheduled sequences does not mean eight full-length 64K conversations fit simultaneously. Longer requests consume more cache and can queue or require recomputation.
These are practical serving profiles, not the model's architectural maximum. The target and drafter declare 262,144 positions, but the entire serving stack must fit alongside weights, cache and working memory. The 200K profile has tight VRAM headroom on the 32 GB R9700 and serves one active request; others wait. Keep its packaged 4,096-token prefill chunk and concurrency settings.78
A final packaged-image check retrieved three markers from a synthetic 195,999-token prompt, producing a 57-token answer. That is a bounded functional check of the 200K profile, not broad long-context reasoning or coding validation. It is separate from the throughput benchmarks. Likewise, two submitted 62,983-token prompts on the 64K image passed with queueing; that does not demonstrate simultaneous residency of two full contexts.8
Tool calls that reach the client
The original parser did not match Qwen's XML tool format. Tool syntax could appear as ordinary response text instead of becoming the structured API call that a client needs to run a tool. The new images correct that server-side parsing with qwen3_xml tool parsing and qwen3 reasoning parsing.78
In these 17 September v1.1.0 images, thinking is disabled by default. Applications can enable it per request with "chat_template_kwargs": {"enable_thinking": true}. This changes request behavior, not the model weights or native-library bytes.
Both corrected images passed the published streaming/non-streaming API tool probes. Separately, the corrected 64K configuration passed an actual OpenCode 1.18.31 file-read/file-write check. These are bounded API and client checks, not a claim of general autonomous coding ability. The tool-test evidence records what was exercised and what was not.
The 64K image in a short-prompt benchmark
With the corrected defaults, we ran the 52-request BetterBench quick workload on one R9700. At eight concurrent requests, the 64K image delivered 304.10 aggregate output tok/s, 67.81 median generation tok/s per request, and 350.84 ms median client time to first token.8
View the benchmark data
| Concurrent requests | Median per request tok/s | Aggregate throughput tok/s | Median TTFT ms |
|---|---|---|---|
| 1 | 99.95 | 84.42 | 106.29 |
| 2 | 89.55 | 152.69 | 168.05 |
| 4 | 86.16 | 230.76 | 182.87 |
| 8 | 67.81 | 304.10 | 350.84 |
Sources:Public benchmark reportSource data (JSON)Request results (JSON)
These three measures answer different questions. Per-request generation measures output after the first streamed update; aggregate throughput measures completed output across the concurrency phase, including prefill. Client TTFT measures the wait for the first response, including HTTP and server waiting, but not the client's concurrency semaphore.
These are short-prompt results on a 64K-capable image, not generation with 64K prompts. The concurrency prompts were 69–116 tokens. There were 10 discarded warmups, a 128-token output cap, and no request errors or preemptions. 37 of 52 measured outputs reached the cap, so successful requests and these speeds do not establish completed-task quality.
The new image defaults to thinking disabled; the earlier release used the checkpoint's thinking default. That changes generated content, lengths and speculative acceptance. This is not a controlled speedup comparison with the earlier release, and it does not replace the original 57% result. See the full report and methodology, summary and per-run results.
Growing conversations: stop reprocessing the same history
17 September investigation. These measurements and availability statements describe the earlier v1.1.0 images and experimental adapter. The new public chat configuration is documented above; do not apply the older 200K cache restriction to that separately tested profile.
A coding agent often resends the conversation so far: instructions, earlier answers, file excerpts and tool results, plus one new turn. Automatic prefix caching (APC) lets the server reuse an unchanged cached beginning instead of processing that history again. This can matter more to the wait before an answer than decode speed alone.
Thank you to the community contributor who identified this gap and demonstrated the workaround. Our earlier fresh-prompt benchmarks did not measure the cost of repeatedly processing a growing history. APC is vLLM's existing reuse mechanism; the new investigation measures its integration with Paiton and the tradeoffs.9
At approximately 40K prompt tokens, the publicly reproducible stock-GDN APC path reduced cold-to-repeat response-start latency from 15.58 to 1.13 seconds. The compact APC-off path continued to process the repeated history. An experimental native-prefill APC candidate also shortened the wait, including on growing follow-ups.
View the benchmark data
| Request stage | Compact native, APC off s | Stock GDN, APC on s | Experimental native prefill, APC on s |
|---|---|---|---|
| Cold | 13.984786 | 15.578310 | 14.679737 |
| Identical repeat | 14.063400 | 1.133075 | 1.089112 |
| Growing follow-up 1 | 14.203211 | 1.230756 | 1.178926 |
| Growing follow-up 2 | 14.387746 | 1.386401 | 1.325764 |
| Request stage | Primary prefix s | Independent confirmation s |
|---|---|---|
| Cold | 88.458190 | 88.610754 |
| Identical repeat | 2.043831 | 2.032992 |
| Growing follow-up 1 | 2.146838 | Not reported |
| Growing follow-up 2 | 2.540300 | Not reported |
Sources:Public benchmark reportSource data (JSON)Request results (JSON)
The separate approximately 150K experiment used an 8 GiB cache, a 160,000-token configured context and one active request. Its experimental native-prefill adapter reduced cold-to-repeat TTFT from 88.46 to 2.04 seconds, independently reproduced with a second distinct prefix at 88.61 to 2.03 seconds. Those are 43–44× shorter response-start waits on cache hits, not faster decode, a competitor comparison or a default benefit of the published image. The largest tested prompt was 150,645 tokens, so this does not qualify full 160K or 200K operation.9
What was available on 17 September
- The 17 September v1.1.0 images default to APC off. The compact native path does not yet support prefix reuse.
- Stock-GDN APC can be tried through the published profile override and reproduction instructions. That recipe uses the pinned 64K image, a 5 GiB cache and one active request.
PAITON_PREFIX_CACHING=1is not distributed in these images. Setting that convenience flag alone does not enable APC; use the documented override.- The native-prefill APC adapter is experimental and unreleased. Its measured results cannot be reproduced from the published image and profile alone.
A workload choice, with real tradeoffs
The current stock-state fallback has lower observed decode performance and usable cache capacity than the compact APC-off path. Reusing a long history can still save substantial waiting, but fresh prompts, changed early tokens, cache eviction and server restarts require processing again. The 40K comparisons used the same 5 GiB budget; the 150K panel is a separate 8 GiB experiment, not an equal-cache comparison against the compact path.
Do not apply stock-state APC to the released 200K profile with its existing 8 GiB cache. That budget is insufficient at a 200K context limit in the pinned sizing calculation. This was a sizing rejection, not an observed GPU out-of-memory event, and a larger allocation remains untested.9
The published retrieval, cached-tool and growing-history checks are useful evidence, not broad model-quality or robustness certification. The APC report retains the control arms, cache-miss checks, measured tradeoffs and limitations. The practical lesson is to measure the conversation, not only how quickly the next answer decodes.
Run it on your R9700
Historical launch commands for reproducing the 16/17 September results only. New deployments should use the ROCm 10 instructions above, with the new checkpoint, launchers and API port.
Use Linux x86-64, Docker and one Radeon AI PRO R9700 with working AMD GPU access. Start with the published launch guide, GHCR package and updated Hugging Face companion. The companion retains the unchanged v1.0.0 native overlay; the new serving profiles are the v1.1.0 GHCR images.107
Run only one profile on the GPU at a time. Both new commands share the persistent model-cache volume and bind the API to localhost. First startup downloads and verifies the pinned target and drafter. Wait for startup to finish before using the endpoint; stop the selected container before switching profiles. No compiler checkout or build is required.
Historical 64K v1.1.0 profile
Version tagghcr.io/eliovp/paiton-vllm-plugin:qwen38-mxfp4-dflash2-rdna4-v1.1.0
docker run --rm -d --name paiton-qwen38-agentic-64k \
  --device /dev/kfd --device /dev/dri --group-add video \
  --shm-size 2g -p 127.0.0.1:8000:8000 \
  -v paiton-qwen38-mxfp4-cache:/models/cache \
  ghcr.io/eliovp/paiton-vllm-plugin@sha256:c3ec2528285b484b2e0af7f571f80f1da23c1970210e4d3d09f5d2a909414186
Historical 200K v1.1.0 profile
One active request, 8 GiB cache, tight VRAM headroom. Keep the packaged concurrency and prefill settings.
Version tagghcr.io/eliovp/paiton-vllm-plugin:qwen38-mxfp4-dflash2-rdna4-200k-v1.1.0
docker run --rm -d --name paiton-qwen38-agentic-200k \
  --device /dev/kfd --device /dev/dri --group-add video \
  --shm-size 2g -p 127.0.0.1:8000:8000 \
  -v paiton-qwen38-mxfp4-cache:/models/cache \
  ghcr.io/eliovp/paiton-vllm-plugin@sha256:28af1731cfd8aceab51915411e8f879531128c2711b4193c76c5b6eba8ba2ef4
Check readiness with curl --fail http://127.0.0.1:8000/health. Use base URL http://127.0.0.1:8000/v1 and model name Qwen3.8-27B-Quark-AWQ-MXFP4. For example, enable thinking explicitly for one request:
curl --fail http://127.0.0.1:8000/v1/chat/completions \
  -H 'Content-Type: application/json' \
  -d '{"model":"Qwen3.8-27B-Quark-AWQ-MXFP4","messages":[{"role":"user","content":"Explain the tradeoffs of prefix caching."}],"temperature":0,"max_tokens":256,"stream":true,"chat_template_kwargs":{"enable_thinking":true}}'
For APC, use the separate stock-GDN profile override, not an unsupported environment flag on these default commands.
Reproduce the original 8K benchmark
The v1.0.0 image remains available unchanged, along with its runtime release notes.11
Version tagghcr.io/eliovp/paiton-vllm-plugin:qwen38-mxfp4-dflash2-rdna4-v1.0.0
docker run -d --name paiton-qwen38-mxfp4 \
  --device /dev/kfd --device /dev/dri --group-add video --shm-size 2g \
  -p 127.0.0.1:8000:8000 \
  -v paiton-qwen38-mxfp4-cache:/models/cache \
  ghcr.io/eliovp/paiton-vllm-plugin@sha256:9b2dae214076d35de785e073b31294b033a376b16e6bc1ec1fdada4e54d96c59
Use the original model guide and benchmark settings to reproduce the historical comparison. Its 5 GiB cache, 8,192-token limit, target and draft snapshots, thinking behavior, speculative settings and APC-off configuration are part of the result. The repository's historical serve.py still selects its original release lock, not either new profile.
Same hardware. A much stronger serving result.
57% more aggregate throughput. 97% lower median time to first token at eight concurrent requests. 2.89× estimated cache-token capacity. Those remain the results of the original matched 188-request, 8K comparison on one Radeon AI PRO R9700 through regular vLLM.
Those historical steps led to the current ROCm 10 release: 400.7 aggregate tok/s in its separate 65K test and a publicly runnable experimental chat configuration for longer histories. Different checkpoints and workloads remain separate; neither replaces the matched scope of the original 57% comparison.
For local developers, that means a stronger shared endpoint from a single workstation GPU. For teams running AMD inference at scale, it is another demonstration of why execution efficiency matters alongside hardware capacity. The R9700 numbers are not a prediction of gains on other AMD platforms.
Running an AMD inference workload that should be delivering more? Talk to us about Paiton. Bring the model, workload and current baseline.
Credit where it belongs
Thank you to the Radiance team for their excellent work on AMD inference and for providing the inspiration and a strong comparison point for this investigation.
We also thank vLLM, StillDeadcode/libr4d, the Qwen and DFlash2 teams, AMD's Quark checkpoint team and BetterBench for the foundations, models and measurement tools that support this work.
The public third-party notices identify the adapted Radiance/libr4d techniques and applicable component terms. This article describes published serving behavior and measurements only. Proprietary compiler documentation and implementation details remain private.
Continue the community discussion
Questions, deployment experiences or a workload we should measure next? Join the r/ROCm discussion about these Qwen3.8 results. The thread discusses two separate comparisons; each retains its own methodology and is not interchangeable with the 17 September quick run or APC experiments.
Sources and benchmark references
Sources
- Current release, benchmark tables and long-context checks, public launcher and image pins. Release dated 18 September; reviewed 19 September 2026. Charts are reproduced from the published rounded tables, not an independently rerun benchmark. 2 3
- ElioVP's supplied benchmark summary and charts; accompanying Paiton benchmark evidence. Full-workload runs 495 / 494; capped comparison runs 403 / 493 / 492. The original 16 September figures come from the supplied summary and charts rather than a raw request log. The new 17 September figures use the public data linked below. 2 3 4 5 6 7 8 9 10 11 12 13 14 15 16
- vLLM-Radiance project documentation, including the same AMD Quark MXFP4 target, DFlash2 profile and explicitly dual-R9700 published measurements. Those external measurements are context, not the denominator of our headline.
- BetterBench. The request counts, selected workload settings and results above come from our supplied run summary.
- Official vLLM plugin-system documentation.
- Paiton.
- Published 64K/200K v1.1.0 launch instructions and immutable image lock. Reviewed 17 September 2026. 2 3 4
- 64K image quick benchmark and tool-support report, its summary, results and source SVG. New figures are redrawn from the published data in ElioVP's visual style. 2 3 4
- APC investigation, published plot data, source SVG and working stock-APC reproduction instructions. Native-prefill APC results require an unreleased adapter. 2 3
- Paiton release companion on Hugging Face.
- Paiton Qwen3.8 MXFP4 + DFlash2 runtime release, including the runtime package and release notes.

